Submitted by EPB Macro Research’s Eric Basmajian,
Real home prices are going to fall, and it’s going to cause a massive negative wealth effect. Real home prices are much more impactful for the wealth effect compared to nominal home prices. Many people invest in real estate as an asset to beat inflation. If inflation is 10% and your home goes up 15%, you beat inflation by 5%, and thus, you are 5% wealthier in real terms. If inflation is 10% and your home goes up 5%, you lost 5% of your purchasing power in an asset that is supposed to give you protection, and you are actually worse off.
Also, real home prices are the best measure of the true performance of real estate as an asset class across long periods of time. You can’t compare home prices today to those in the 1970s without looking at them in real or inflation-adjusted terms.
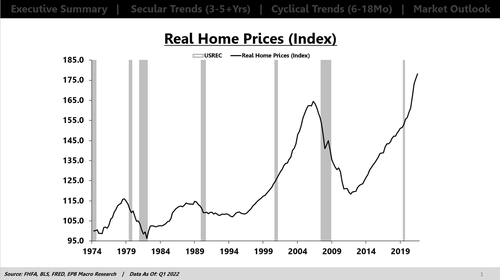
This chart shows real home prices since the 1970s, and you can see that real home prices have declined several times, mainly around the recessionary periods.
The 2000s recession was an outlier in which home prices rose in real terms.
The financial crisis in 2008 caused home prices to decline by almost 30% in real terms. It took until 2021 to regain the peak in real home prices in 2006, 15 years!
Over the last ten years, real home price growth averaged 4.5%, which is way higher than the 20-year average of 2%.
Consumers and investors became accustomed to home prices rising sharply above the rate of inflation and a source of wealth building, particularly when using high amounts of leverage and mortgage debt.
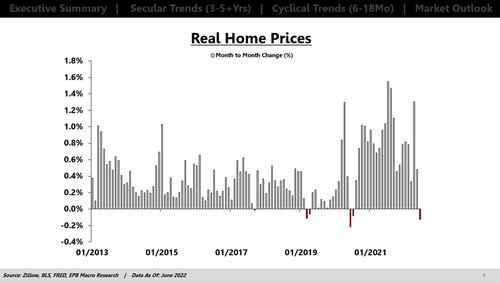
With the feeling that home prices would always rise above inflation and nearly 5% above inflation, a prevailing sentiment was born that you could leverage your way to wealth. But now, real home prices are starting to decline.
One month is certainly not a trend, but this is where the EPB process becomes very powerful and why studying leading indicators is critical when determining what noise is and what’s the start of a new trend.
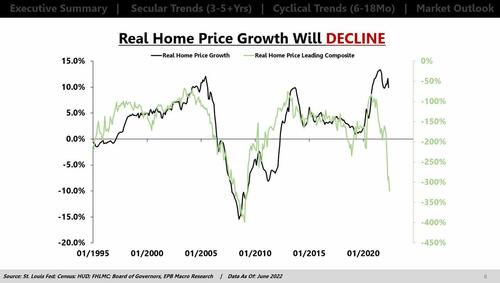
There are several key leading indicators of real home prices, but this video covers just three: the months’ supply of new homes, the spread between 30YR mortgage rates and 30YR Treasury rates, and the growth rate of real M2. All three indicators imply the rate of real home price appreciation is likely to decline in the months ahead.
This video explains the data behind these leading indicators and real home prices.


