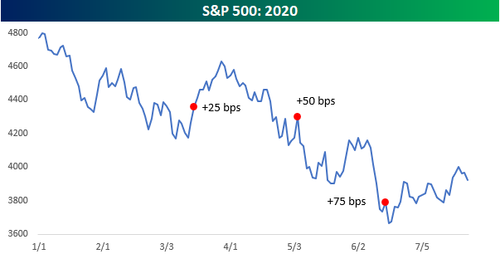
A chart by Bespoke Investment making the rounds this morning shows the profound (and bullish) impact FOMC days have had on the market in 2022: according to their analysis, if you only owned the market on days when the FOMC hiked rates (i.e., the March, May and June FOMC meetings), you’d be looking at a YTD gain of 6.8%. If you avoided the market on those 3 days and were long the rest of the year, you’d be down 23%.
Since one would expect risk assets to have a negative reaction to Fed tightening via rate hikes – especially in a pre-recession economy – this appears somewhat counterintuitive which is why as Bespoke notes, “Nobody ever said the market had to make sense!”
It also would suggest that – with the Fed in hiking mode for at least the next few meetings – one should aggressively buy stocks. But is that really accurate?
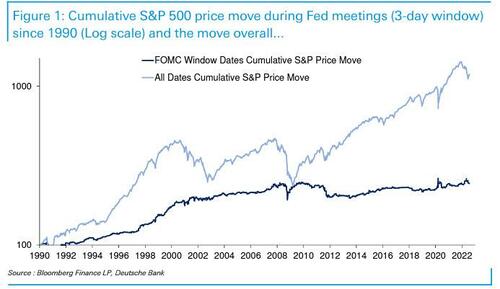
Well, not so fast, because according to a separate analysis by Deutsche Bank, the S&P 500 has actually been flat on the roughly 360 FOMC 3-day window days since the GFC first rumbled in 2007 even though this period has seen the Fed increase their balance sheet from under $1tn to around $9tn today and cut rates numerous times.
The background is well-known: since the GFC lows the S&P 500 has been up over 400%, so we’ve seen one of the biggest US equity bull markets in history since the GFC without much help from the roughly 10% of FOMC window days even with their extreme actions seen over this period.
As DB’s Jim Reid breaks it down, it’s fair to say that up until the global financial crisis, the FOMC days made up a disproportionally big part of the S&P cumulative return given that they only account for 10% of trading days. However – and this may come as a shock to all those who swear by the so-called “Pre-FOMC Drift” – since then they’ve accounted for no part of the rally! As Reid adds, “I’ve no idea why that might be the case. All suggestions welcome. Maybe the gravity of the problems we’ve faced since the GFC have come into focus over FOMC periods (helping bonds rally) but outside of this the market went back to focusing on the extreme risk-on liquidity they provided. Just a theory!”
But while the jury may be out on how to trade stocks on FOMC days, there is a far more clear verdict when it comes to bonds.
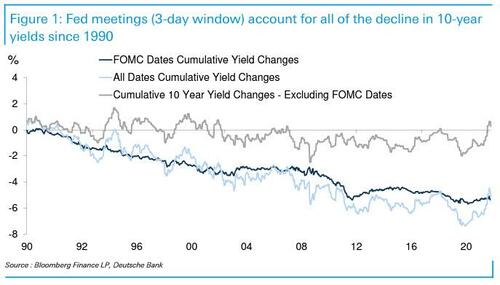
In a separate note from the DB strategist, he reminds readers that 10-year Treasuries have had a remarkable run since 1990 where the entire rally in over the period can be fully accounted for by a 3-day period from the start of each FOMC meeting!
Over this period, DB calculates that there have been around 8500 business days and the 845 FOMC 3-day window days accounted for a cumulative 540 bps rally in 10 year Treasuries versus a 510 bps decline overall. Meanwhile, if one strips out FOMC meetings, the 10-year yield would have been a random walk without any trend for thirty years and yields would now be slightly higher than in 1990 when they were c.8%!
Having said that, up until April 2020, these numbers were around -730bps (total move over 30 years) and -200bps (total non-FOMC window 30 year move) so there has been some reversal in the overall level of yields since. However, a glance at the graph shows that none of this occurred in the 3-day FOMC windows over the last couple of years.
So FOMC periods have remained relatively dovish – at least when it comes to bonds – in what has been a 2-year bear market even as they have taken a hawkish turn. Perhaps its been a case of buy the rumor and sell the fact on the Fed’s hawkishness or perhaps it’s because they have remained behind the curve.


